Timeline Report - Access Right Configuration
To access the timeline report page the new access right should be written to the database via JSON file with the help of a migration tool.
| Access Right | Requires federated login configuration? | Description |
|---|---|---|
| TimelineReportAccess | No | Can access the timeline report page and track the time spent by the resources on missions. |
We have modified the access rights needed to get the mission data displayed in the timeline report in the release 21 version.
For release version 21 or above to get the mission data displayed in the timeline, the user needs any one of the listed access permissions based on their access level.
| Access Right | Requires federated login configuration? | Description |
|---|---|---|
| AllTimelineReport | No | Can include all organization and departments journals in the time line report. |
| OrganizationalTimelineReport | Yes | Can include organization journals in the time line report. |
| DepartmentTimelineReport | Yes | Can include department journals in the time line report. |
For release versions 18,19 and 20 to get the mission data displayed in the timeline, the user needs any one of the listed view journal access permissions based on their access level.
| Access Right | Requires federated login configuration? | Description |
|---|---|---|
| AllJournalView | No | Can include all organization and departments journals in the time line report. |
| OrganizationJournalView | Yes | Can include organization journals in the time line report. |
| DepartmentJournalView | Yes | Can include department journals in the time line report. |
| UserJournalView | Yes | Can include user's own journals in the time line report. |
View the timeline report page in Insight
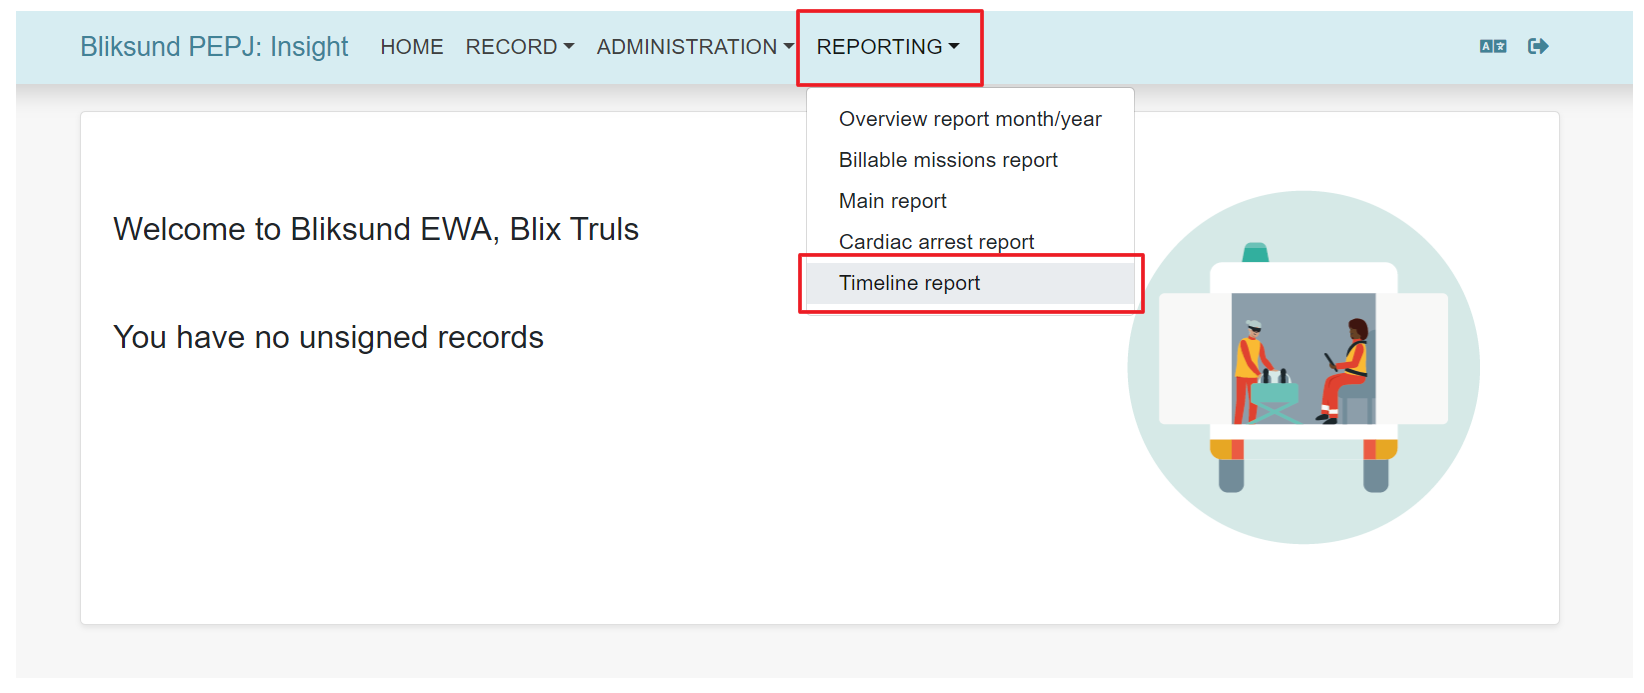
Once the user has the required access rights navigate to the timeline report page by clicking on Reporting -------> Timeline Report in the main menu.
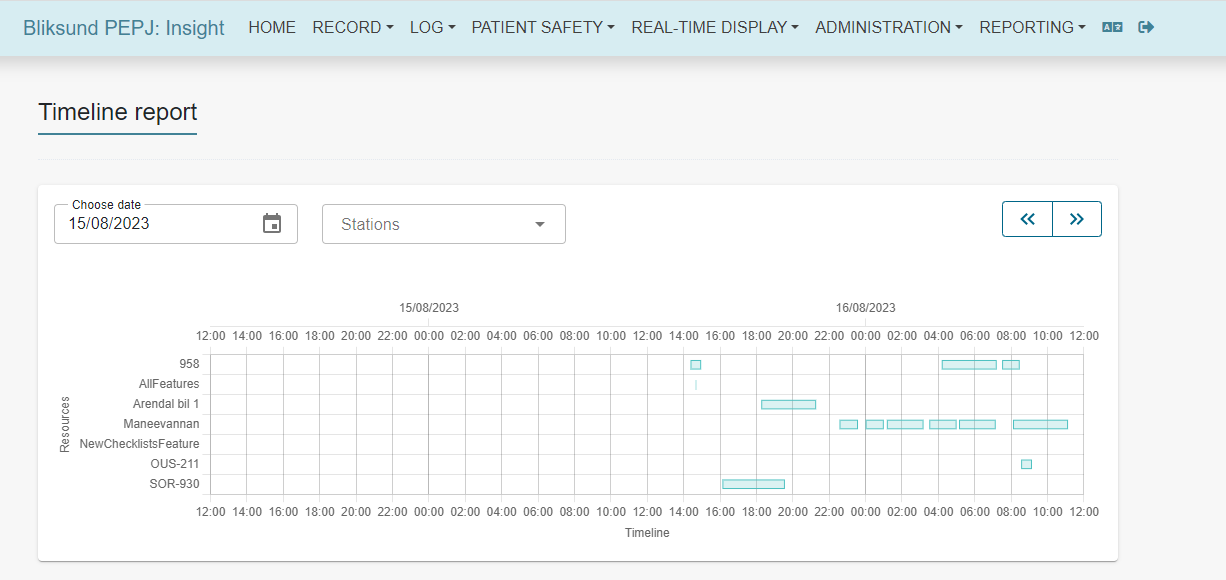
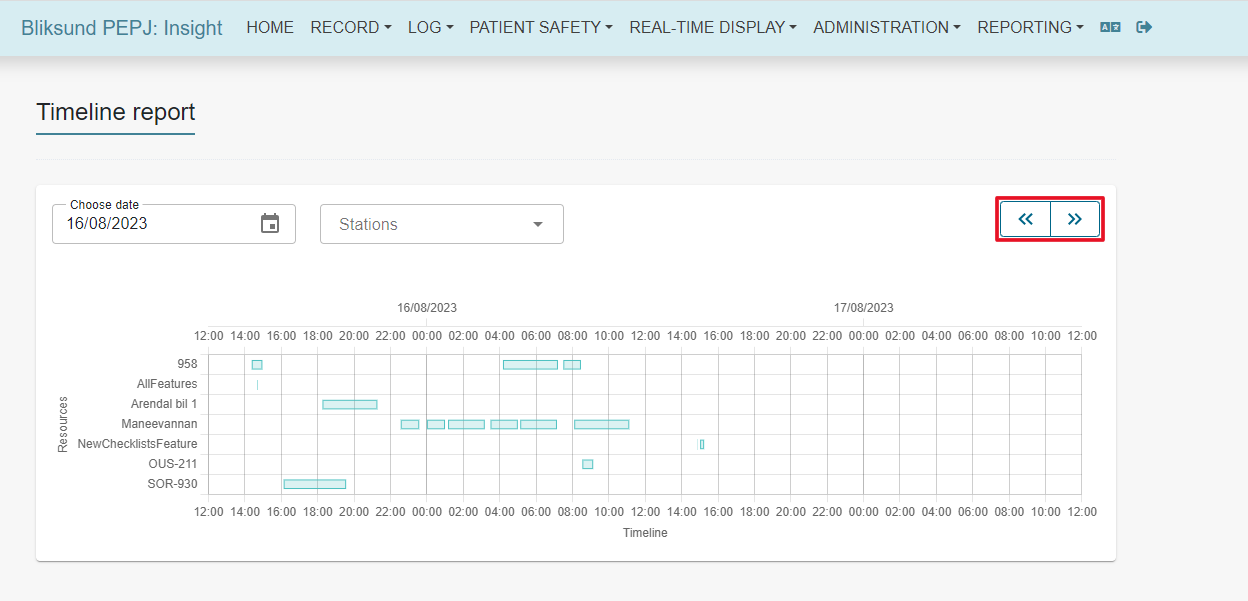
The timeline report includes completed missions from the resources, The missions are represented in the timeline with a blue line, and it is plotted with respect to the start and completion time of the mission. The report will help to keep track of how much the resources have driven on the selected date and determine the rest time in between missions.
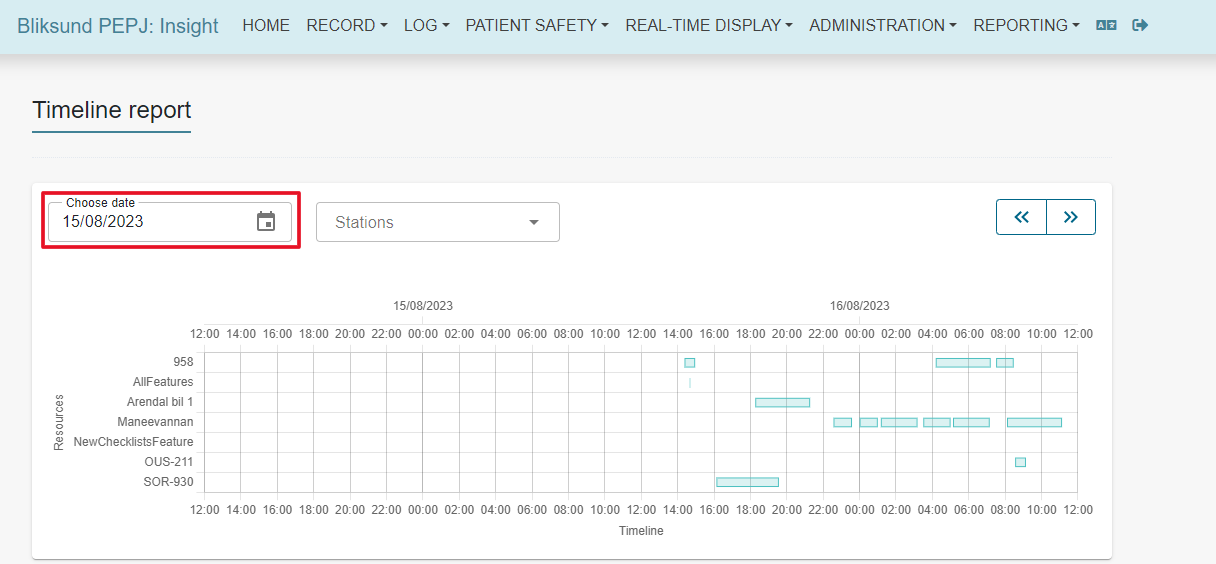
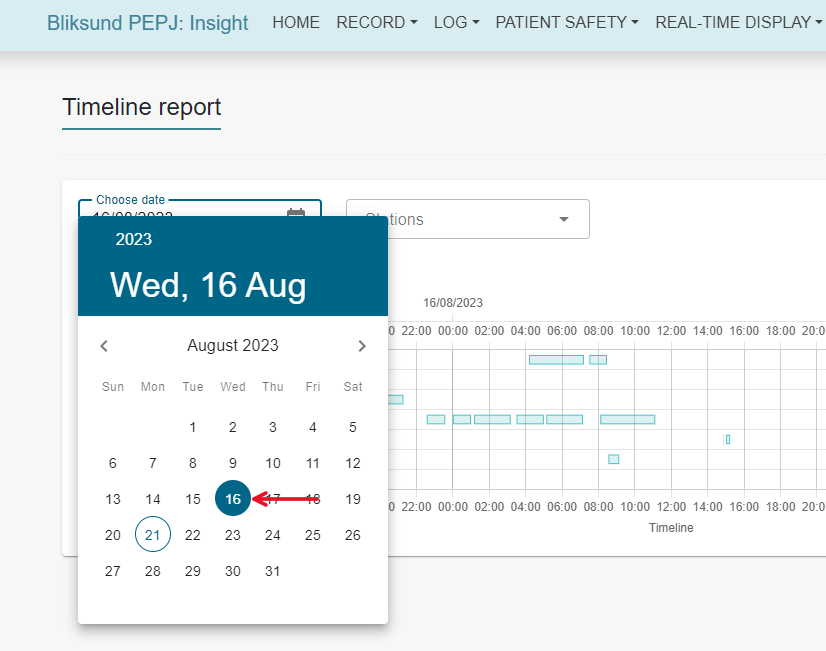
- The report generated displays the timeline for 48 hours. By default, the timeline is generated based on the current date. Users could change the date by modifying the date selected using the date picker or by clicking the timeline navigation button on the timeline report page. For example, when the selected date is the 16th of August, The timeline displays the entire 24-hour window on the 16th of August and 12-hour on the previous day (15th of August) and 12hrs on the next day (17th of August).
-
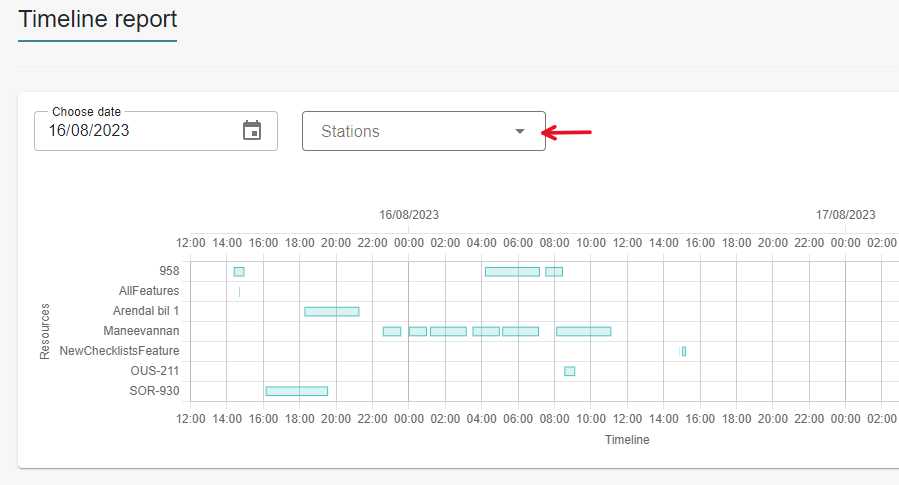
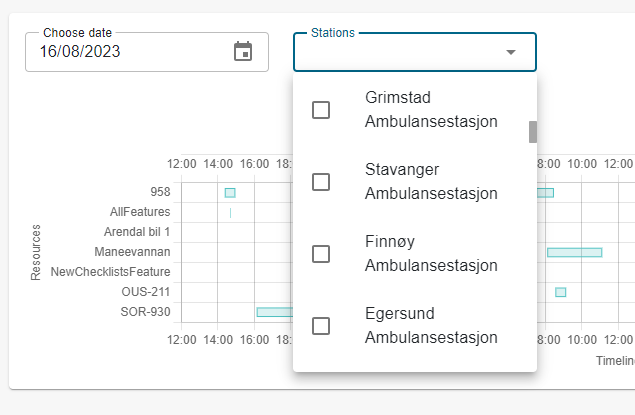
The timeline report can be filtered based on stations, select one or many stations in the filter and the timeline report is generated based on the selected stations.(The functionality is available from release 21)
-
Resources are displayed from the lowest to the highest number (Ascending) in the overview list. (The functionality is available from release 21)
-
Only completed missions will be displayed in the timeline report. The time for the selected date range is displayed in the top and bottom of the report, the resources are displayed in the left-hand pane.
-
The mission time span is represented by blue lines in the report with respect to the resource, start and completion time of the mission.
-
Users could mouse over the blue lines displayed in the report to get more information on the mission. The mouse-over pop-up shows the resource name, journal ID, start and completion time of the mission.
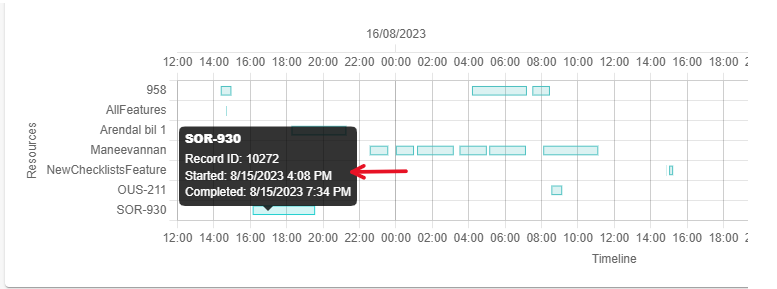
- The chart can be zoomed in or zoomed out with mouse scroll up or scroll down action to view the data more precisely.